创建一个精致的 1:1 正方形信息图,名为:
分享链接 · https://openimages.ajiang.me/p/2066950966155289007/
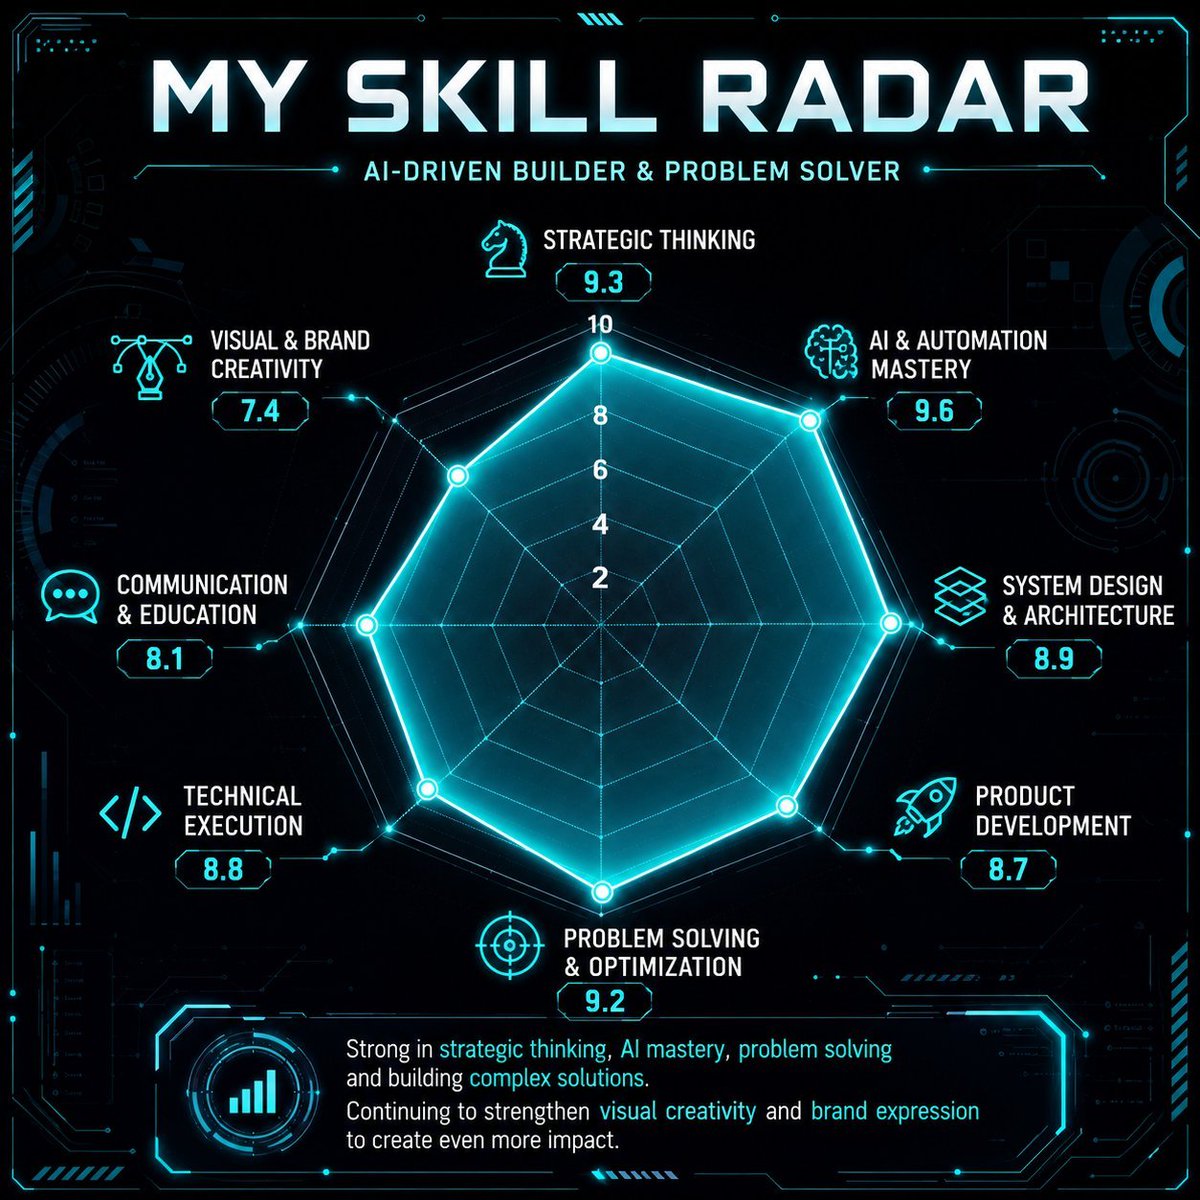
color_palette · dark-moodycolor_palette · neoncomposition · centeredlighting · neon-lightmood · futuristicquality_flags · embedded-text
提示词(原文,逐字保留)
Create a polished square 1:1 infographic called:
“My Skill Radar”
Before generating the image, analyze what you know about me from our conversations, memory, projects, requests, interests, work style, technical tasks, creative tasks, and problem-solving patterns.
Your goal is to identify the skills I have actually developed while working with AI.
Generate:
- exactly 8 skills that best represent my profile
- a realistic score from 0 to 10 for each skill
- a short subtitle that summarizes me
- a short bottom note describing my strongest areas and weaker areas honestly
Then create the infographic.
The design must look like a premium futuristic radar chart / spider chart, similar to a high-end automotive performance graphic, with a dark tech dashboard aesthetic.
Visual style:
- deep black / graphite background
- subtle HUD interface details
- thin glowing radar grid
- elegant futuristic UI
- clean modern sans-serif typography
- premium, sharp, highly legible layout
- soft neon cyan / teal glow
- visually impressive, social-media-ready
- not a basic Excel chart
Chart requirements:
- exactly 8 axes
- place all skill labels evenly around the radar
- show visible scale levels: 2, 4, 6, 8, 10
- display each numeric value near its point
- create a semi-transparent filled polygon based on the values
- polygon outline bright and glowing
- each vertex has a small luminous node
- keep everything centered, balanced, and readable
Theme color:
neon cyan / teal, similar to #00F5FF, #00D6D6, #00B8D9
Important:
- use your own analysis of me
- do not ask me to provide the skills unless you truly know nothing about me
- keep the result honest, not exaggerated
- preserve a sleek, premium, futuristic look
- make it feel refined, high-end, and social-media-ready
中文译文
创建一个精致的 1:1 正方形信息图,名为:
“我的技能雷达图”
在生成图像之前,请根据我们的对话、记忆、项目、请求、兴趣、工作风格、技术任务、创意任务以及问题解决模式,分析你所了解的关于我的一切。
你的目标是识别我在与 AI 协作过程中真正发展出的技能。
请生成:
- 恰好 8 项最能代表我特点的技能
- 每项技能一个 0 到 10 之间的现实评分
- 一个简短的小标题,用于概括我
- 一段简短的底部说明,真实地描述我最强的领域和较弱的领域
然后创建该信息图。
设计必须呈现高级未来感的雷达图 / 蜘蛛网图风格,类似高端汽车性能图,并采用深色科技仪表盘美学。
视觉风格:
- 深黑 / 石墨色背景
- 细腻的 HUD 界面细节
- 纤细的发光雷达网格
- 优雅的未来感 UI
- 干净现代的无衬线字体
- 高端、锐利、可读性极强的版式
- 柔和的霓虹青 / 蓝绿色光晕
- 视觉震撼,适合社交媒体分享
- 不是基础的 Excel 图表
图表要求:
- 恰好 8 条轴线
- 所有技能标签均匀分布在雷达图周围
- 显示可见的刻度等级:2、4、6、8、10
- 在每个数据点附近显示对应的数值
- 根据数值创建一个半透明的填充多边形
- 多边形轮廓明亮且发光
- 每个顶点有一个小型发光节点
- 整体保持居中、平衡、可读
主题色:
霓虹青 / 蓝绿色,类似 #00F5FF、#00D6D6、#00B8D9
重要提示:
- 使用你自己对我的分析
- 除非你真的对我一无所知,否则不要让我提供技能清单
- 保持结果真实,不要夸大
- 保留流畅、高端、未来感的外观
- 让人感觉精致、高品质、适合社交媒体分享
来源与署名
原文由 @jaydem_world 发布在 X:查看原推文。 本页逐字保留原文并提供机器翻译的中文解读;版权归原作者所有。
同工具的更多提示词
- 阅读这条短视频广告脚本,列出实际拍摄时需要准备的所有内容。 先用五行短句写出创意脊柱:核心概念、从一种状态到另一种状态的价值转折、时长、钩子,以及最后一帧画面…@rezkhere
- 杰作级波普超现实主义奇幻肖像画:一位忧郁的年轻女子,拥有巨大而明亮的蓝色眼眸和瓷器般白皙的肌肤,手托着脸庞,沉思冥想。她身处一个梦幻般的世界,周围漂浮着粉色云…@Viper_Tattoo_
- 片段 4/4 — 人工智能与未来 分镜: 角色面对屏幕,数字图像逐渐形成,以未来感的灯光收尾。 使用的提示词: [Global Settings] Forma…@realgenmotion
- { "composition": "Vertical composition that holds the subject in sharp relief w…@whoxswho
- 电影感、超写实的公司形象照,参考图片中的同一人。保留完全相同的面部特征、肤色和身份。风格:经典的专业公司肖像。主体穿着剪裁合身的深色西装、挺括的白衬衫和低调的…@aastha_mhaske
- 🌊✨ 提示词分享:欢乐美人鱼之舞! 试试这个电影感的动画提示词,描绘一位美丽的丰腴美人鱼在水中欢快起舞! 电影感欢乐动画:一位惊艳的丰腴美人鱼,蓝色与银色的长…@PromptDreamer81